


Icing Frequency
The map shows the frequency of meteorological icing at 100 m height above ground for the period between August 2007 and July 2009. The 10-year-average value of icing frequency is about 5% lower.
The map is based on raster information on cloud water, temperature and wind from the analysis of COSMO-2, the weather forecast model of MeteoSwiss. This data is used as input for an icing algorithm that simulates the ice mass accretion on a freely rotating cylindric structure. The simulated icing frequency is given on a 2.2 km raster and was verified using measurements from the IMIS measurement network in the Alpine region and measurements in the Jura region.
Icing influences the planning of a wind energy project as well as the operation of wind turbines (WT) in several ways:
- Ice accretion at rotor blades disturbs the aerodynamics of the blades and often necessitates a shut down of WT, thus causing production losses.
- Ice throw poses a security risk for passers-by and service employees.
- Additional and unbalanced loads cause additional fatigue of the materials.
- Iced wind measurement sensors at the wind turbine's nacelle lead to erroneous behavior and security stops.
What does "meteorological icing" mean?
Icing of meteorological instruments as well as other structures proceeds in different stages that may be described as follows:
- Meteorological icing:
Period when meteorological conditions favor ice growth and ice builds up (blue box in the figure). - Instrumental icing:
Period when the instrument is covered by ice and icing causes a malfunction of the measurement sensor or the WT (orange box in the figure). - Incubation time:
Delay between the start of meteorological and the start of instrumental icing. - Recovery time:
Delay between the end of the meteorological icing and the start of the normal, ice-free operation of the measurement sensor or WT.
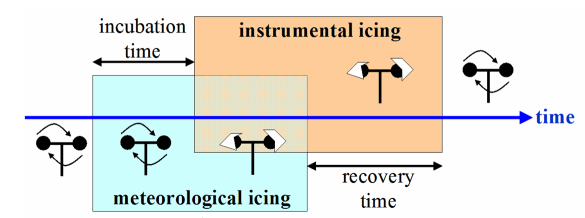
Figure: Different stages during the icing of meteorological instruments or other structures.
The period of instrumental icing is generally much longer than that of meteorological icing.
Interpretation of the map
The map of icing frequency allows to qualitatively evaluate the risk of icing and to judge if it is necessary to make further arrangements during the planning phase of a wind energy project. When using the map the following issues should be considered:
- The icing frequency values are not to be interpreted as exact point values. The map rather indicates if the region in consideration lies in an area with frequent icing. In that case, it should be envisaged to take additional measurements during the planning phase of the wind energy project that allow determining the icing frequency (e.g. heated and unheated wind measurement sensors).
- The region in consideration might be characterized by small-scale landscape characteristics (strongly exposed or sheltered) such as is often the case in the inner Alps. If so, the value on the map is not representative for this region. The true value of icing frequency will be higher compared to the value on the map for exposed locations and lower for sheltered locations.
- The map shows the frequency of meteorological icing. Periods of instrumental icing will generally be longer (first estimates for the Jura region show a ratio of 1:4).
Further information
A detailed description of the methodology and the verification results is given in the final report of the research project "Vereisungskarte der Schweiz" (supported by the SFOE).
Further information about icing:
- Wind Energy in Cold Climates, IEA Task 19
» Website